It is very tricky question. Truncate releases the memory. In Oracle, PostgreSQL, MySQL it is DDL. So I believe it will be DDL for other RDBMS also. Most of the RDBMS it drops the table and recreate the schema, thus making truncate faster then Delete. Truncate is fast because there is no where clause like delete and also because the data rows still exists in data pages but extent is marked empty for reuse. Truncate don't scan table like in delete, so the process is faster in truncate. Also truncate don't get logged in log file. We can not truncate table where constraint exists, we need to remove constraints, truncate table and again add back the constraint. Truncate will reset the identity column, which means row id will be 1.
Friday, 18 November 2016
NETSTAT
When we issue netstat command we can see what are the ports listening on my system. Print network connections, routing tables, interface statistics, masquerade connections, and multicast memberships. Netstat prints information about the Linux networking subsystem.
[root@rahul-linux ~]# netstat -an |grep 5432
tcp 0 0 192.168.140.102:5432 0.0.0.0:* LISTEN
tcp 0 0 192.168.160.102:5432 0.0.0.0:* LISTEN
tcp 0 0 192.168.198.102:5432 0.0.0.0:* LISTEN
-l or --listening shows only the sockets currently listening for incoming connection.
-a or --all shows all sockets currently in use.
-t or --tcp shows the tcp sockets.
-u or --udp shows the udp sockets.
-n or --numeric shows the hosts and ports as numbers, instead of resolving in dns and looking in /etc/services.
netstat -atn # For tcp
netstat -aun # For udp
netstat -atun # For both
NSLOOKUP
Nslookup helps us find possible IP addresses of any site like www.google.com
SAR in Linux
The SAR command extracts and writes to standard output records previously saved in a file. The SAR command only reports on local activities. Each time we need to run /usr/lib64/sa/sa1 to get status updated into /var/log/sa/sa27. To install SAR we need to install yum install sysstat
[root@ip-172-31-28-103 sa]# /usr/lib64/sa/sa1
[root@ip-172-31-28-103 sa]# sar
Linux 3.10.0-514.el7.x86_64 (ip-172-31-28-103.ec2.internal) 11/27/2016 _x86_64_ (1 CPU)
[root@rahul-linux1 ~]# sar --CPU Info
Linux 3.8.13-118.13.2.el6uek.x86_64 (rcdn9-emaas-rdb-001) 11/18/2016 _x86_64_ (120 CPU)
12:00:01 AM CPU %user %nice %system %iowait %steal %idle
12:10:01 AM all 1.86 0.00 0.75 0.02 0.00 97.37
12:20:02 AM all 2.20 0.00 0.93 0.02 0.00 96.85
12:30:01 AM all 1.96 0.00 0.79 0.02 0.00 97.23
12:40:01 AM all 1.81 0.00 0.73 0.01 0.00 97.45
12:50:01 AM all 2.52 0.00 1.10 0.02 0.00 96.36
01:00:01 AM all 1.67 0.00 0.75 0.02 0.00 97.56
01:10:01 AM all 2.23 0.00 0.85 0.02 0.00 96.90
01:20:01 AM all 1.85 0.00 0.76 0.01 0.00 97.37
01:30:01 AM all 1.81 0.00 0.73 0.02 0.00 97.44
[root@ip-172-31-28-103 sa]# sar -S --SWAP
Linux 3.10.0-514.el7.x86_64 (ip-172-31-28-103.ec2.internal) 11/27/2016 _x86_64_ (1 CPU)
12:58:31 AM kbswpfree kbswpused %swpused kbswpcad %swpcad
12:58:53 AM 0 0 0.00 0 0.00
12:59:08 AM 0 0 0.00 0 0.00
01:00:02 AM 0 0 0.00 0 0.00
01:01:42 AM 0 0 0.00 0 0.00
Average: 0 0 0.00 0 0.00
[root@ip-172-31-28-103 sa]# sar -b --I/O Details read, write, transaction, bytes read
Linux 3.10.0-514.el7.x86_64 (ip-172-31-28-103.ec2.internal) 11/27/2016 _x86_64_ (1 CPU)
12:58:31 AM tps rtps wtps bread/s bwrtn/s
12:58:53 AM 0.40 0.00 0.40 0.00 5.42
12:59:08 AM 0.07 0.00 0.07 0.00 1.13
01:00:02 AM 0.30 0.00 0.30 0.00 4.39
01:01:42 AM 0.29 0.00 0.29 0.00 3.81
Average: 0.29 0.00 0.29 0.00 3.97
[root@ip-172-31-28-103 sa]# sar -d --device
Linux 3.10.0-514.el7.x86_64 (ip-172-31-28-103.ec2.internal) 11/27/2016 _x86_64_ (1 CPU)
12:58:31 AM DEV tps rd_sec/s wr_sec/s avgrq-sz avgqu-sz await svctm %util
12:58:53 AM dev202-0 0.40 0.00 5.42 13.67 0.00 0.44 0.11 0.00
12:59:08 AM dev202-0 0.07 0.00 1.13 16.00 0.00 0.00 0.00 0.00
01:00:02 AM dev202-0 0.30 0.00 4.39 14.88 0.00 0.12 0.12 0.00
01:01:42 AM dev202-0 0.29 0.00 3.81 13.21 0.00 0.34 0.10 0.00
01:10:01 AM dev202-0 0.17 0.02 2.77 15.94 0.00 0.33 0.14 0.00
Average: dev202-0 0.21 0.01 3.10 15.12 0.00 0.32 0.13 0.00
[root@ip-172-31-28-103 sa]# sar -w --Context switch
Linux 3.10.0-514.el7.x86_64 (ip-172-31-28-103.ec2.internal) 11/27/2016 _x86_64_ (1 CPU)
12:58:31 AM proc/s cswch/s
12:58:53 AM 0.31 61.01
12:59:08 AM 0.42 68.39
01:00:02 AM 0.18 61.34
01:01:42 AM 0.27 61.04
01:10:01 AM 0.06 56.94
Average: 0.12 58.25
[root@ip-172-31-28-103 sa]# sar -r --Run Queue and Load Average
Linux 3.10.0-514.el7.x86_64 (ip-172-31-28-103.ec2.internal) 11/27/2016 _x86_64_ (1 CPU)
12:58:31 AM kbmemfree kbmemused %memused kbbuffers kbcached kbcommit %commit kbactive kbinact kbdirty
12:58:53 AM 130192 884784 87.17 0 671728 550932 54.28 385096 340260 20
12:59:08 AM 130120 884856 87.18 0 671732 550932 54.28 385108 340252 20
01:00:02 AM 129492 885484 87.24 0 671784 552864 54.47 385580 340248 16
01:01:42 AM 130088 884888 87.18 0 671748 550932 54.28 385120 340256 24
01:10:01 AM 127892 887084 87.40 0 671816 556896 54.87 386680 340268 28
Average: 129557 885419 87.24 0 671762 552511 54.44 385517 340257 22
[root@ip-172-31-28-103 sa]# sar -p --CPU Usage
Linux 3.10.0-514.el7.x86_64 (ip-172-31-28-103.ec2.internal) 11/27/2016 _x86_64_ (1 CPU)
12:58:31 AM CPU %user %nice %system %iowait %steal %idle
12:58:53 AM all 0.04 0.00 0.04 0.00 0.04 99.87
12:59:08 AM all 0.07 0.00 0.00 0.00 0.00 99.93
01:00:02 AM all 0.02 0.00 0.09 0.00 0.42 99.46
01:01:42 AM all 0.04 0.00 0.05 0.00 0.09 99.82
01:10:01 AM all 0.01 0.00 0.01 0.00 0.01 99.97
Average: all 0.02 0.00 0.03 0.00 0.05 99.91
[root@ip-172-31-28-103 sa]# sar -u CPU Usage
Linux 3.10.0-514.el7.x86_64 (ip-172-31-28-103.ec2.internal) 11/27/2016 _x86_64_ (1 CPU)
12:58:31 AM CPU %user %nice %system %iowait %steal %idle
12:58:53 AM all 0.04 0.00 0.04 0.00 0.04 99.87
12:59:08 AM all 0.07 0.00 0.00 0.00 0.00 99.93
01:00:02 AM all 0.02 0.00 0.09 0.00 0.42 99.46
01:01:42 AM all 0.04 0.00 0.05 0.00 0.09 99.82
01:10:01 AM all 0.01 0.00 0.01 0.00 0.01 99.97
Average: all 0.02 0.00 0.03 0.00 0.05 99.91
[root@ip-172-31-28-103 sa]# /usr/lib64/sa/sa1
[root@ip-172-31-28-103 sa]# sar
Linux 3.10.0-514.el7.x86_64 (ip-172-31-28-103.ec2.internal) 11/27/2016 _x86_64_ (1 CPU)
[root@ip-172-31-28-103 sa]# /usr/lib64/sa/sa1
[root@ip-172-31-28-103 sa]# sar
Linux 3.10.0-514.el7.x86_64 (ip-172-31-28-103.ec2.internal) 11/27/2016 _x86_64_ (1 CPU)
12:58:31 AM CPU %user %nice %system %iowait %steal %idle
12:58:53 AM all 0.04 0.00 0.04 0.00 0.04 99.87
Average: all 0.04 0.00 0.04 0.00 0.04 99.87
[root@ip-172-31-28-103 sa]# /usr/lib64/sa/sa1
[root@ip-172-31-28-103 sa]# sar
Linux 3.10.0-514.el7.x86_64 (ip-172-31-28-103.ec2.internal) 11/27/2016 _x86_64_ (1 CPU)
12:58:31 AM CPU %user %nice %system %iowait %steal %idle
12:58:53 AM all 0.04 0.00 0.04 0.00 0.04 99.87
12:59:08 AM all 0.07 0.00 0.00 0.00 0.00 99.93
Average: all 0.05 0.00 0.03 0.00 0.03 99.89
Linux 3.8.13-118.13.2.el6uek.x86_64 (rcdn9-emaas-rdb-001) 11/18/2016 _x86_64_ (120 CPU)
12:00:01 AM CPU %user %nice %system %iowait %steal %idle
12:10:01 AM all 1.86 0.00 0.75 0.02 0.00 97.37
12:20:02 AM all 2.20 0.00 0.93 0.02 0.00 96.85
12:30:01 AM all 1.96 0.00 0.79 0.02 0.00 97.23
12:40:01 AM all 1.81 0.00 0.73 0.01 0.00 97.45
12:50:01 AM all 2.52 0.00 1.10 0.02 0.00 96.36
01:00:01 AM all 1.67 0.00 0.75 0.02 0.00 97.56
01:10:01 AM all 2.23 0.00 0.85 0.02 0.00 96.90
01:20:01 AM all 1.85 0.00 0.76 0.01 0.00 97.37
01:30:01 AM all 1.81 0.00 0.73 0.02 0.00 97.44
[root@ip-172-31-28-103 sa]# sar -S --SWAP
Linux 3.10.0-514.el7.x86_64 (ip-172-31-28-103.ec2.internal) 11/27/2016 _x86_64_ (1 CPU)
12:58:31 AM kbswpfree kbswpused %swpused kbswpcad %swpcad
12:58:53 AM 0 0 0.00 0 0.00
12:59:08 AM 0 0 0.00 0 0.00
01:00:02 AM 0 0 0.00 0 0.00
01:01:42 AM 0 0 0.00 0 0.00
Average: 0 0 0.00 0 0.00
[root@ip-172-31-28-103 sa]# sar -b --I/O Details read, write, transaction, bytes read
Linux 3.10.0-514.el7.x86_64 (ip-172-31-28-103.ec2.internal) 11/27/2016 _x86_64_ (1 CPU)
12:58:31 AM tps rtps wtps bread/s bwrtn/s
12:58:53 AM 0.40 0.00 0.40 0.00 5.42
12:59:08 AM 0.07 0.00 0.07 0.00 1.13
01:00:02 AM 0.30 0.00 0.30 0.00 4.39
01:01:42 AM 0.29 0.00 0.29 0.00 3.81
Average: 0.29 0.00 0.29 0.00 3.97
[root@ip-172-31-28-103 sa]# sar -d --device
Linux 3.10.0-514.el7.x86_64 (ip-172-31-28-103.ec2.internal) 11/27/2016 _x86_64_ (1 CPU)
12:58:31 AM DEV tps rd_sec/s wr_sec/s avgrq-sz avgqu-sz await svctm %util
12:58:53 AM dev202-0 0.40 0.00 5.42 13.67 0.00 0.44 0.11 0.00
12:59:08 AM dev202-0 0.07 0.00 1.13 16.00 0.00 0.00 0.00 0.00
01:00:02 AM dev202-0 0.30 0.00 4.39 14.88 0.00 0.12 0.12 0.00
01:01:42 AM dev202-0 0.29 0.00 3.81 13.21 0.00 0.34 0.10 0.00
01:10:01 AM dev202-0 0.17 0.02 2.77 15.94 0.00 0.33 0.14 0.00
Average: dev202-0 0.21 0.01 3.10 15.12 0.00 0.32 0.13 0.00
[root@ip-172-31-28-103 sa]# sar -w --Context switch
Linux 3.10.0-514.el7.x86_64 (ip-172-31-28-103.ec2.internal) 11/27/2016 _x86_64_ (1 CPU)
12:58:31 AM proc/s cswch/s
12:58:53 AM 0.31 61.01
12:59:08 AM 0.42 68.39
01:00:02 AM 0.18 61.34
01:01:42 AM 0.27 61.04
01:10:01 AM 0.06 56.94
Average: 0.12 58.25
[root@ip-172-31-28-103 sa]# sar -r --Run Queue and Load Average
Linux 3.10.0-514.el7.x86_64 (ip-172-31-28-103.ec2.internal) 11/27/2016 _x86_64_ (1 CPU)
12:58:31 AM kbmemfree kbmemused %memused kbbuffers kbcached kbcommit %commit kbactive kbinact kbdirty
12:58:53 AM 130192 884784 87.17 0 671728 550932 54.28 385096 340260 20
12:59:08 AM 130120 884856 87.18 0 671732 550932 54.28 385108 340252 20
01:00:02 AM 129492 885484 87.24 0 671784 552864 54.47 385580 340248 16
01:01:42 AM 130088 884888 87.18 0 671748 550932 54.28 385120 340256 24
01:10:01 AM 127892 887084 87.40 0 671816 556896 54.87 386680 340268 28
Average: 129557 885419 87.24 0 671762 552511 54.44 385517 340257 22
[root@ip-172-31-28-103 sa]# sar -p --CPU Usage
Linux 3.10.0-514.el7.x86_64 (ip-172-31-28-103.ec2.internal) 11/27/2016 _x86_64_ (1 CPU)
12:58:31 AM CPU %user %nice %system %iowait %steal %idle
12:58:53 AM all 0.04 0.00 0.04 0.00 0.04 99.87
12:59:08 AM all 0.07 0.00 0.00 0.00 0.00 99.93
01:00:02 AM all 0.02 0.00 0.09 0.00 0.42 99.46
01:01:42 AM all 0.04 0.00 0.05 0.00 0.09 99.82
01:10:01 AM all 0.01 0.00 0.01 0.00 0.01 99.97
Average: all 0.02 0.00 0.03 0.00 0.05 99.91
[root@ip-172-31-28-103 sa]# sar -u CPU Usage
Linux 3.10.0-514.el7.x86_64 (ip-172-31-28-103.ec2.internal) 11/27/2016 _x86_64_ (1 CPU)
12:58:31 AM CPU %user %nice %system %iowait %steal %idle
12:58:53 AM all 0.04 0.00 0.04 0.00 0.04 99.87
12:59:08 AM all 0.07 0.00 0.00 0.00 0.00 99.93
01:00:02 AM all 0.02 0.00 0.09 0.00 0.42 99.46
01:01:42 AM all 0.04 0.00 0.05 0.00 0.09 99.82
01:10:01 AM all 0.01 0.00 0.01 0.00 0.01 99.97
Average: all 0.02 0.00 0.03 0.00 0.05 99.91
Default Gateway in Linux
What is Gateway?
A gateway is a network point that acts as an entrance to another network. On the Internet, a node or stopping point can be either a gateway node or a host (end-point) node. Both the computers of Internet users and the computers that serve pages to users are host nodes. The computers that control traffic within your company’s network or at your local Internet service provider (ISP) are gateway nodes. In the network for an enterprise, a computer server acting as a gateway node is often also acting as a proxy server and a firewall server. A gateway is often associated with both a router, which knows where to direct a given packet of data that arrives at the gateway, and a switch, which furnishes the actual path in and out of the gateway for a given packet.
How to find default gateway?
rahul-linux:~$ ip route show
default via 192.168.1.1 dev eth1 proto static
192.168.1.0/24 dev eth1 proto kernel scope link src 192.168.1.100 metric 1
rahul-linux:~$ netstat -rn
Kernel IP routing table
Destination Gateway Genmask Flags MSS Window irtt Iface
0.0.0.0 192.168.1.1 0.0.0.0 UG 0 0 0 eth1
192.168.1.0 0.0.0.0 255.255.255.0 U 0 0 0 eth1
The flag U indicates that route is up and G indicates that it is gateway.
rahul-linux:~$ route -n
Kernel IP routing table
Destination Gateway Genmask Flags Metric Ref Use Iface
0.0.0.0 192.168.1.1 0.0.0.0 UG 0 0 0 eth1
192.168.1.0 0.0.0.0 255.255.255.0 U 1 0 0 eth1
How to find gateway?
[root@rhel7 ~]# routel
target gateway source proto scope dev tbl
10.0.0.0/ 8 10.1.1.56 kernel link enp0s3
10.0.0.0 broadcast 10.1.1.56 kernel link enp0s3 local
10.1.1.56 local 10.1.1.56 kernel host enp0s3 local
10.255.255.255 broadcast 10.1.1.56 kernel link enp0s3 local
127.0.0.0 broadcast 127.0.0.1 kernel link lo local
127.0.0.0/ 8 local 127.0.0.1 kernel host lo local
127.0.0.1 local 127.0.0.1 kernel host lo local
127.255.255.255 broadcast 127.0.0.1 kernel link lo local
[root@rhel7 ~]# cat /etc/sysconfig/network
GATEWAY="10.1.1.1"
[root@rhel7 ~]# routel | grep default
default 10.1.1.1 static enp0s3
default unreachable kernel lo unspec
default unreachable kernel lo unspec
IOSTAT in Linux
IOSTAT: Report Central Processing Unit (CPU) statistics and input/output statistics for devices and partitions. The first report generated by the iostat command provides statistics concerning the time since the system was booted. Each subsequent report covers the time since the previous report. All statistics are reported each time the iostat command is run. A device header row is displayed followed by a line of statistics for each device that is configured. The iostat command generates two types of reports, the CPU Utilization report and the Device Utilization report.
[root@rahul-linux ~]# iostat 5
Linux 3.8.13-118.13.2.el6uek.x86_64 (rahul-linux) 11/18/2016 _x86_64_ (120 CPU)
avg-cpu: %user %nice %system %iowait %steal %idle
0.99 0.00 0.24 0.01 0.00 98.76
Device: tps Blk_read/s Blk_wrtn/s Blk_read Blk_wrtn
fioa 8.74 0.11 10774.22 312495 30035875404
fiob 165.60 385.39 4082.03 1074372153 11379708364
fioc 220.45 352.78 16401.66 983474378 45723802863
sda 1.90 0.62 91.51 1720980 255100394
dm-0 1.90 0.61 91.49 1708384 255048440
dm-1 0.00 0.00 0.00 3576 1736
dm-2 0.00 0.00 0.02 2456 50200
dm-3 541.44 738.28 31257.91 2058152399 87139386631
sdb 4.78 0.57 7000.35 1576711 19515259748
dm-4 4.73 0.18 7000.35 512943 19515259748
dm-5 6.09 0.18 7000.35 512535 19515259748
avg-cpu: %user %nice %system %iowait %steal %idle
1.36 0.00 0.72 0.01 0.00 97.92
Device: tps Blk_read/s Blk_wrtn/s Blk_read Blk_wrtn
fioa 0.00 0.00 0.00 0 0
fiob 11.00 0.00 418.40 0 2092
fioc 273.20 0.00 11328.00 0 56640
sda 0.00 0.00 0.00 0 0
dm-0 0.00 0.00 0.00 0 0
dm-1 0.00 0.00 0.00 0 0
dm-2 0.00 0.00 0.00 0 0
dm-3 438.60 0.00 11746.40 0 58732
sdb 0.20 0.00 17.60 0 88
dm-4 0.20 0.00 17.60 0 88
dm-5 0.20 0.00 17.60 0 88
CPU Utilization Report
The first report generated by the iostat command is the CPU Uti-
lization Report. For multiprocessor systems, the CPU values are
global averages among all processors. The report has the fol-
lowing format:
%user
Show the percentage of CPU utilization that occurred
while executing at the user level (application).
%nice
Show the percentage of CPU utilization that occurred
while executing at the user level with nice priority.
%sys
Show the percentage of CPU utilization that occurred
while executing at the system level (kernel).
%iowait
Show the percentage of time that the CPU or CPUs were
idle during which the system had an outstanding disk I/O
request.
%idle
Show the percentage of time that the CPU or CPUs were
idle and the system did not have an outstanding disk I/O
request.
Device Utilization Report
The second report generated by the iostat command is the Device
Utilization Report. The device report provides statistics on a
per physical device or partition basis. Block devices for which
statistics are to be displayed may be entered on the command
line. Partitions may also be entered on the command line provid-
ing that option -x is not used. If no device nor partition is
entered, then statistics are displayed for every device used by
the system, and providing that the kernel maintains statistics
for it. If the ALL keyword is given on the command line, then
statistics are displayed for every device defined by the system,
including those that have never been used. The report may show
the following fields, depending on the flags used:
Device:
This column gives the device (or partition) name, which
is displayed as hdiskn with 2.2 kernels, for the nth
device. It is displayed as devm-n with 2.4 kernels, where
m is the major number of the device, and n a distinctive
number. With newer kernels, the device name as listed in
the /dev directory is displayed.
tps
Indicate the number of transfers per second that were
issued to the device. A transfer is an I/O request to the
device. Multiple logical requests can be combined into a
single I/O request to the device. A transfer is of inde-
terminate size.
Blk_read/s
Indicate the amount of data read from the drive expressed
in a number of blocks per second. Blocks are equivalent
to sectors with 2.4 kernels and newer and therefore have
a size of 512 bytes. With older kernels, a block is of
indeterminate size.
Blk_wrtn/s
Indicate the amount of data written to the drive
expressed in a number of blocks per second.
Blk_read
The total number of blocks read.
Blk_wrtn
The total number of blocks written.
kB_read/s
Indicate the amount of data read from the drive expressed
in kilobytes per second. Data displayed are valid only
with kernels 2.4 and newer.
kB_wrtn/s
Indicate the amount of data written to the drive
expressed in kilobytes per second. Data displayed are
valid only with kernels 2.4 and newer.
kB_read
The total number of kilobytes read. Data displayed are
valid only with kernels 2.4 and newer.
[root@linux-rahul ~]# iostat -c Only CPU
Linux 3.8.13-118.13.2.el6uek.x86_64 (rahul-linux) 11/18/2016 _x86_64_ (120 CPU)
avg-cpu: %user %nice %system %iowait %steal %idle
0.99 0.00 0.24 0.01 0.00 98.75
[root@linux-rahul ~]# iostat -d Only Device
Linux 3.8.13-118.13.2.el6uek.x86_64 (rahul-linux) 11/18/2016 _x86_64_ (120 CPU)
Device: tps Blk_read/s Blk_wrtn/s Blk_read Blk_wrtn
fioa 8.73 0.12 10755.19 333951 30035903001
fiob 166.50 583.31 4079.87 1629000641 11393799263
fioc 220.66 352.32 16417.93 983924234 45850168738
sda 1.90 0.65 91.53 1813636 255626242
dm-0 1.90 0.62 91.48 1726024 255479808
dm-1 0.01 0.03 0.03 78592 96216
dm-2 0.00 0.00 0.02 2456 50200
dm-3 542.70 935.75 31252.98 2613252199 87279871002
sdb 5.13 0.57 7295.49 1579140 20374046075
dm-4 5.09 0.18 7295.49 513484 20374046075
dm-5 6.74 0.18 7295.49 513076 20374046075
[root@rahul-linux ~]# iostat -k in KB
Linux 3.8.13-118.13.2.el6uek.x86_64 (rahul-linux) 11/18/2016 _x86_64_ (120 CPU)
avg-cpu: %user %nice %system %iowait %steal %idle
0.99 0.00 0.24 0.01 0.00 98.75
Device: tps kB_read/s kB_wrtn/s kB_read kB_wrtn
fioa 8.73 0.06 5377.52 166975 15017951525
fiob 166.50 291.65 2039.94 814508468 5696982119
fioc 220.66 176.16 8208.99 491962261 22925454142
sda 1.90 0.32 45.77 906818 127814321
dm-0 1.90 0.31 45.74 863012 127741104
dm-1 0.01 0.01 0.02 39296 48108
dm-2 0.00 0.00 0.01 1228 25100
dm-3 542.70 467.87 15626.45 1306634391 43640387787
sdb 5.14 0.28 3649.91 789574 10193186452
dm-4 5.09 0.09 3649.91 256742 10193186452
dm-5 6.75 0.09 3649.91 256538 10193186452
[root@rahul-linux ~]# iostat -m in MB
Linux 3.8.13-118.13.2.el6uek.x86_64 (rahul-linux) 11/18/2016 _x86_64_ (120 CPU)
avg-cpu: %user %nice %system %iowait %steal %idle
0.99 0.00 0.24 0.01 0.00 98.75
Device: tps MB_read/s MB_wrtn/s MB_read MB_wrtn
fioa 8.73 0.00 5.25 163 14665968
fiob 166.50 0.28 1.99 795421 5563516
fioc 220.66 0.17 8.02 480431 22388319
sda 1.90 0.00 0.04 885 124819
dm-0 1.90 0.00 0.04 842 124748
dm-1 0.01 0.00 0.00 38 46
dm-2 0.00 0.00 0.00 1 24
dm-3 542.70 0.46 15.26 1276012 42617804
sdb 5.14 0.00 3.57 771 9957800
dm-4 5.10 0.00 3.57 250 9957800
dm-5 6.76 0.00 3.57 250 9957864
[root@rahul-linux ~]# iostat -p fioa
Linux 3.8.13-118.13.2.el6uek.x86_64 (rahul-linux) 11/18/2016 _x86_64_ (120 CPU)
avg-cpu: %user %nice %system %iowait %steal %idle
0.99 0.00 0.24 0.01 0.00 98.75
Device: tps Blk_read/s Blk_wrtn/s Blk_read Blk_wrtn
fioa 8.73 0.12 10753.41 334395 30035905061
fioa1 0.00 0.00 0.00 0 0
[root@rahul-linux ~]# iostat -t 5
Linux 3.8.13-118.13.2.el6uek.x86_64 (rahul-linux) 11/18/2016 _x86_64_ (120 CPU)
11/18/2016 07:20:22 PM
avg-cpu: %user %nice %system %iowait %steal %idle
0.99 0.00 0.24 0.01 0.00 98.75
Device: tps Blk_read/s Blk_wrtn/s Blk_read Blk_wrtn
fioa 8.73 0.12 10753.01 334821 30035905341
fiob 166.59 604.30 4079.58 1687969584 11395299639
fioc 220.68 352.40 16418.57 984334427 45861237484
sda 1.90 0.65 91.53 1814468 255672866
dm-0 1.90 0.62 91.48 1726856 255526024
dm-1 0.01 0.03 0.03 78592 96624
dm-2 0.00 0.00 0.02 2456 50200
dm-3 542.82 956.82 31251.16 2672632205 87292442464
sdb 5.20 0.57 7368.63 1589948 20582464808
dm-4 5.15 0.19 7368.63 524076 20582464808
dm-5 6.83 0.19 7368.63 523668 20582464808
11/18/2016 07:20:27 PM
avg-cpu: %user %nice %system %iowait %steal %idle
4.43 0.00 1.96 0.14 0.00 93.47
[root@rahul-linux ~]# iostat -V
sysstat version 9.0.4
(C) Sebastien Godard (sysstat <at> orange.fr)
[root@rahul-linux ~]# iostat -x
Linux 3.8.13-118.13.2.el6uek.x86_64 (rahul-linux) 11/18/2016 _x86_64_ (120 CPU)
avg-cpu: %user %nice %system %iowait %steal %idle
0.99 0.00 0.24 0.01 0.00 98.75
Device: rrqm/s wrqm/s r/s w/s rsec/s wsec/s avgrq-sz avgqu-sz await r_await w_await svctm %util
fioa 0.00 0.00 0.00 8.73 0.12 10752.80 1232.05 0.46 173.23 0.21 173.25 0.34 0.30
fiob 0.00 0.00 3.33 163.29 611.07 4079.53 28.15 0.33 7.59 0.17 7.74 0.01 0.11
fioc 0.00 0.00 1.80 218.88 352.39 16418.47 76.00 1.03 0.49 0.19 0.49 0.06 1.24
sda 0.00 0.00 0.03 1.87 0.65 91.53 48.61 0.06 30.66 0.98 31.13 1.13 0.21
dm-0 0.00 0.00 0.03 1.87 0.62 91.48 48.60 0.06 30.65 1.00 31.10 1.10 0.21
dm-1 0.00 0.00 0.00 0.00 0.03 0.03 8.00 0.01 877.21 1.18 1589.75 8.69 0.01
dm-2 0.00 0.00 0.00 0.00 0.00 0.02 74.06 0.00 5.67 1.04 7.24 2.38 0.00
dm-3 0.00 0.00 5.13 537.72 963.58 31250.80 59.34 0.01 0.01 0.19 0.01 0.04 2.37
sdb 0.00 0.00 0.06 5.15 0.57 7375.37 1416.59 0.26 50.25 1.48 50.78 1.06 0.55
dm-4 0.00 1.69 0.01 5.15 0.19 7375.37 1429.62 0.26 51.33 1.75 51.41 1.08 0.56
dm-5 0.00 0.00 0.01 6.85 0.19 7375.37 1076.25 0.36 52.80 1.75 52.86 0.81 0.56
kB_wrtn
The total number of kilobytes written. Data displayed are
valid only with kernels 2.4 and newer.
rrqm/s
The number of read requests merged per second that were
issued to the device.
wrqm/s
The number of write requests merged per second that were
issued to the device.
r/s
The number of read requests that were issued to the
device per second.
w/s
The number of write requests that were issued to the
device per second.
rsec/s
The number of sectors read from the device per second.
wsec/s
The number of sectors written to the device per second.
rkB/s
The number of kilobytes read from the device per second.
wkB/s
The number of kilobytes written to the device per second.
avgrq-sz
The average size (in sectors) of the requests that were
issued to the device.
avgqu-sz
The average queue length of the requests that were issued
to the device.
await
The average time (in milliseconds) for I/O requests
issued to the device to be served. This includes the time
spent by the requests in queue and the time spent servic-
ing them.
svctm
The average service time (in milliseconds) for I/O
requests that were issued to the device.
%util
Percentage of CPU time during which I/O requests were
issued to the device (bandwidth utilization for the
device). Device saturation occurs when this value is
close to 100%.
iostat -d 2 6
Display six reports at two second intervals for all devices.
[root@rahul-linux ~]# iostat -d 6 2 -t
Linux 3.8.13-118.13.2.el6uek.x86_64 (rahul-linux) 11/18/2016 _x86_64_ (120 CPU)
11/18/2016 07:25:11 PM
Device: tps Blk_read/s Blk_wrtn/s Blk_read Blk_wrtn
fioa 8.73 0.12 10751.90 335575 30035906676
fiob 166.65 619.32 4079.29 1730095952 11395684530
fioc 220.76 367.26 16418.48 1025968411 45865736276
sda 1.90 0.65 91.53 1814532 255696042
dm-0 1.90 0.62 91.48 1726856 255549200
dm-1 0.01 0.03 0.03 78656 96624
dm-2 0.00 0.00 0.02 2456 50200
dm-3 542.97 986.70 31249.67 2756393311 87297327482
sdb 5.25 0.57 7403.48 1592940 20681943282
dm-4 5.20 0.19 7403.48 526964 20681943282
dm-5 6.93 0.19 7403.52 526556 20682064482
11/18/2016 07:25:17 PM
Device: tps Blk_read/s Blk_wrtn/s Blk_read Blk_wrtn
fioa 0.33 0.00 2.83 0 17
fiob 60.83 176.00 907.33 1056 5444
fioc 1781.83 273525.33 26716.00 1641152 160296
sda 5.00 0.00 552.00 0 3312
dm-0 5.00 0.00 552.00 0 3312
dm-1 0.00 0.00 0.00 0 0
dm-2 0.00 0.00 0.00 0 0
dm-3 1992.17 273701.33 27626.17 1642208 165757
sdb 311.17 5.33 252283.50 32 1513701
dm-4 311.00 4.00 252283.50 24 1513701
dm-5 527.00 4.00 238552.83 24 1431317
VMSTAT in Linux
Reports Virtual Memory Statistics. It reports information about processes, memory, paging, block IO, taps, and CPU activity. The first report produced gives averages since the last reboot. Additional reports give information on a sampling period of length delay. The process and memory reports are instantaneous in either case.
VMSTAT does not require special permissions. These reports are intended to help identify system bottlenecks. Linux VMSTAT does not count itself as a running process. All linux blocks are currently 1024 bytes. Old kernels may report blocks as 512 bytes, 2048 bytes, or 4096 bytes. Since procps 3.1.9, vmstat lets you choose units (k, K, m, M) default is K (1024 bytes) in the default mode
Other way to get information are /proc/meminfo , /proc/stat, /proc/*/stat.
Some of the examples are below:
[root@rahul@linux ~] vmstat
procs -----------memory---------- ---swap-- -----io---- --system-- -----cpu-----
r b swpd free buff cache si so bi bo in cs us sy id wa st
18 0 708 96000856 464 2555262208 0 0 3 160 0 0 1 0 99 0 0
[root@rcdn9-emaas-rdb-001 ~]#
Procs
r: The number of processes waiting for run time.
b: The number of processes in uninterruptible sleep.
Memory
swpd: the amount of virtual memory used.
free: the amount of idle memory.
buff: the amount of memory used as buffers.
cache: the amount of memory used as cache.
inact: the amount of inactive memory. (-a option)
active: the amount of active memory. (-a option)
Swap
si: Amount of memory swapped in from disk (/s).
so: Amount of memory swapped to disk (/s).
IO
bi: Blocks received from a block device (blocks/s).
bo: Blocks sent to a block device (blocks/s).
System
in: The number of interrupts per second, including the clock.
cs: The number of context switches per second.
CPU
These are percentages of total CPU time.
us: Time spent running non-kernel code. (user time, including nice time)
sy: Time spent running kernel code. (system time)
id: Time spent idle. Prior to Linux 2.5.41, this includes IO-wait time.
wa: Time spent waiting for IO. Prior to Linux 2.5.41, shown as zero.
[root@rahul@linux ~]# vmstat -a Active/Inactive Memory
procs -----------memory---------- ---swap-- -----io---- --system-- -----cpu-----
r b swpd free inact active si so bi bo in cs us sy id wa st
3 0 708 95259808 1758343168 822516864 0 0 3 160 0 0 1 0 99 0 0
[root@rahul@linux ~]# vmstat -f
31309949 forks
Number of forks since last restart. Number of tasks. Each process is represented by one or more tasks, depending on thread usage. This display does not repeat.
[root@rahul@linux ~]# vmstat -m Displays slabinfo
Cache Num Total Size Pages
nf_conntrack_ffff89e99b09ae00 0 0 304 13
cache: Cache name
num: Number of currently active objects
total: Total number of available objects
size: Size of each object
pages: Number of pages with at least one active object
totpages: Total number of allocated pages
pslab: Number of pages per slab
[root@rahul@linux ~]# vmstat -n Same as vmstat
procs -----------memory---------- ---swap-- -----io---- --system-- -----cpu-----
r b swpd free buff cache si so bi bo in cs us sy id wa st
1 0 692 80950576 464 2569727744 0 0 3 160 0 0 1 0 99 0 0
[root@rahul@linux ~]# vmstat -s -- Event Counter and memory statistics
2774295808 total memory
2697926400 used memory
826923712 active memory
1772232960 inactive memory
76369280 free memory
464 buffer memory
2574770944 swap cache
4194300 total swap
692 used swap
4193608 free swap
328301314 non-nice user cpu ticks
3542 nice user cpu ticks
70364589 system cpu ticks
32954132294 idle cpu ticks
4865037 IO-wait cpu ticks
6250 IRQ cpu ticks
9848009 softirq cpu ticks
0 stolen cpu ticks
1030697686 pages paged in
53379068841 pages paged out
104 pages swapped in
217 pages swapped out
1162661649 interrupts
2277229811 CPU context switches
1476703567 boot time
31474117 forks
[root@rahul@linux ~]# vmstat -5
usage: vmstat [-V] [-n] [delay [count]]
-V prints version.
-n causes the headers not to be reprinted regularly.
-a print inactive/active page stats.
-d prints disk statistics
-D prints disk table
-p prints disk partition statistics
-s prints vm table
-m prints slabinfo
-t add timestamp to output
-S unit size
delay is the delay between updates in seconds.
unit size k:1000 K:1024 m:1000000 M:1048576 (default is K)
count is the number of updates.
[root@rahul@linux ~]# vmstat 5
procs -----------memory---------- ---swap-- -----io---- --system-- -----cpu-----
r b swpd free buff cache si so bi bo in cs us sy id wa st
1 0 692 75732416 464 2575491584 0 0 3 160 0 0 1 0 99 0 0
5 0 692 75689440 464 2575514112 0 0 0 5130 17034 21562 2 1 97 0 0
4 0 692 75722464 464 2575530752 0 0 0 12456 15821 14389 1 1 98 0 0
4 0 692 75746632 464 2575555584 0 0 0 7586 15094 16254 1 1 99 0 0
8 0 692 75745712 464 2575565824 0 0 1 19883 16983 16501 2 1 97 0 0
[root@rahul@linux ~]# vmstat -d disk statistics
disk- ------------reads------------ ------------writes----------- -----IO------
total merged sectors ms total merged sectors ms cur sec
ram0 0 0 0 0 0 0 0 0 0 0
ram1 0 0 0 0 0 0 0 0 0 0
ram2 0 0 0 0 0 0 0 0 0 0
ram3 0 0 0 0 0 0 0 0 0 0
ram4 0 0 0 0 0 0 0 0 0 0
ram5 0 0 0 0 0 0 0 0 0 0
ram6 0 0 0 0 0 0 0 0 0 0
ram7 0 0 0 0 0 0 0 0 0 0
ram8 0 0 0 0 0 0 0 0 0 0
ram9 0 0 0 0 0 0 0 0 0 0
ram10 0 0 0 0 0 0 0 0 0 0
ram11 0 0 0 0 0 0 0 0 0 0
ram12 0 0 0 0 0 0 0 0 0 0
ram13 0 0 0 0 0 0 0 0 0 0
ram14 0 0 0 0 0 0 0 0 0 0
ram15 0 0 0 0 0 0 0 0 0 0
loop0 0 0 0 0 0 0 0 0 0 0
loop1 0 0 0 0 0 0 0 0 0 0
loop2 0 0 0 0 0 0 0 0 0 0
loop3 0 0 0 0 0 0 0 0 0 0
loop4 0 0 0 0 0 0 0 0 0 0
loop5 0 0 0 0 0 0 0 0 0 0
loop6 0 0 0 0 0 0 0 0 0 0
loop7 0 0 0 0 0 0 0 0 0 0
zram0 0 0 0 0 0 0 0 0 0 0
fioa 3254 0 312287 674 24372260 0 30035851875 4223132598 0 8400
fiob 6074950 0 1074323673 1057472 455289506 0 11372152579 3526281277 0 3000
fioc 5011713 0 983469690 965440 608269179 0 45632450256 263461364 0 34203
sda 80705 607 1720668 77844 5198429 245 254745602 161652896 0 5797
dm-0 79653 0 1708072 78040 5197923 0 254693648 161865943 0 5780
dm-1 447 0 3576 957 217 0 1736 99496 0 10
dm-2 180 0 2456 188 531 0 50200 3846 0 1
dm-3 11088876 0 2058099023 2130356 1495829218 0 87040454710 4234588663 0 65385
sdb 153548 0 1575199 200552 13143910 0 19489567165 616883680 0 14527
dm-4 20766 6 512943 14624 13143910 3800089 19489567165 625004708 0 14648
dm-5 20721 0 512535 14520 16944001 0 19489567165 837507283 0 14653
Reads
total: Total reads completed successfully
merged: grouped reads (resulting in one I/O)
sectors: Sectors read successfully
ms: milliseconds spent reading
Writes
total: Total writes completed successfully
merged: grouped writes (resulting in one I/O)
sectors: Sectors written successfully
ms: milliseconds spent writing
IO
cur: I/O in progress
s: seconds spent for I/O
[root@rahul@linux ~]# vmstat -p /dev/shm
Partition was not found
[root@rahul@linux ~]# vmstat -S K
procs -----------memory---------- ---swap-- -----io---- --system-- -----cpu-----
r b swpd free buff cache si so bi bo in cs us sy id wa st
1 0 692 70379232 464 2579287040 0 0 3 160 0 0 1 0 99 0 0
[root@rahul@linux ~]# vmstat -S k
procs -----------memory---------- ---swap-- -----io---- --system-- -----cpu-----
r b swpd free buff cache si so bi bo in cs us sy id wa st
0 0 708 72121024 475 2641190144 0 0 3 160 0 0 1 0 99 0 0
[root@rahul@linux~]# vmstat -S m
procs -----------memory---------- ---swap-- -----io---- --system-- -----cpu-----
r b swpd free buff cache si so bi bo in cs us sy id wa st
2 0 0 72135 0 2641250 0 0 3 160 0 0 1 0 99 0 0
[root@rahul@linux ~]# vmstat -S M
procs -----------memory---------- ---swap-- -----io---- --system-- -----cpu-----
r b swpd free buff cache si so bi bo in cs us sy id wa st
4 0 0 68850 0 2518896 0 0 3 160 0 0 1 0 99 0 0
[root@rahul@linux ~]# vmstat -V
procps version 3.2.8
Saturday, 5 November 2016
Inode in Linux
Let us take a small example where every citizen in European country have a unique personal Identification number. This helps government to track all citizen, helps in documentation. Similar way we have Inodes for all files in linux. During the initial set up of the OS, we define the number of inodes and number of files that is possible in the OS. Inode is a data structure which keeps information of all files like size, user id, group id, permission. But it will not keep information of file name so hard links work fine. We can check inodes with the below command:
[postgres@ip-172-31-28-103 data]$ df -i
Filesystem Inodes IUsed IFree IUse% Mounted on
/dev/xvda2 5241840 41618 5200222 1% /
devtmpfs 122059 281 121778 1% /dev
tmpfs 126872 3 126869 1% /dev/shm
tmpfs 126872 337 126535 1% /run
tmpfs 126872 16 126856 1% /sys/fs/cgroup
tmpfs 126872 1 126871 1% /run/user/1000
Thursday, 3 November 2016
Soft vs Hard Link in Linux
In linux we have something called links which replicates contents of one file to another with symbolic links. We called them -
a. Soft Link
b. Hard Link
Below is a small diagram which explains the full story.

a. Soft Link
b. Hard Link
Below is a small diagram which explains the full story.
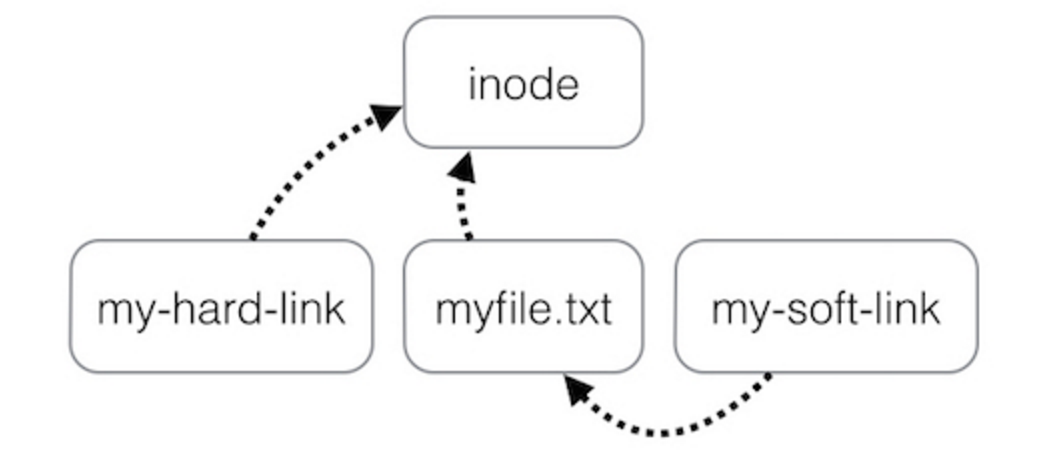
Soft Link
Soft link is symbolic link of one file or directory. We create soft link using the command -
shell> ln -s file_to_be_linked linked_file
For example, we need to link postgresql-9.3.1 to postgresql. We will issue the below command -
shell> ln -s postgresql-9.3.1 postgresql
In soft link, if we delete/rename the postgresql, the contents are deleted permanently. But if we replace the contents of postgresql-9.3.1, there will be no harm to the link. But if we rename postgresql-9.3.1, then postgresql wont work because soft link was linked with file not the content. If we move postgresql-9.3.1 to different location, postgresql will not be accessible.
We create such links where we want the file name to be present in the directory but content should append in different location.
Hard Link
Hard link are links which contents same information between two files. We create hard link issuing the below command -
shell> ln postgresql-9.3.1 postgresql
If we delete postgresql-9.3.1, still we will be able to access postgresql because the link file points to the same inode. Inode is a data structure which keeps information of all files like size, user id, group id, permission. Hardlinks can only be possible within the same file system as inode is same. Hard links are only possible for files not for directory. Performance will be better here as it will contact the disk pointer.
Subscribe to:
Posts (Atom)